Mercator projection
Background to the schools Wikipedia
SOS Children made this Wikipedia selection alongside other schools resources. Before you decide about sponsoring a child, why not learn about different sponsorship charities first?

The Mercator projection is a cylindrical map projection presented by the Flemish geographer and cartographer Gerardus Mercator, in 1569. It became the standard map projection for nautical purposes because of its ability to represent lines of constant true bearing or true course, known as rhumb lines, as straight line segments. While the direction and shapes are accurate on a Mercator projection, it distorts size, in an increasing degree away from the equator.
Properties and historical details
Mercator's 1569 edition was a large planisphere measuring 202 by 124 cm, printed in eighteen separate sheets. As in all cylindrical projections, parallels and meridians are straight and perpendicular to each other. In accomplishing this, the unavoidable east-west stretching of the map, which increases as distance away from the equator increases, is accompanied by a corresponding north-south stretching, so that at every point location, the east-west scale is the same as the north-south scale, making the projection conformal. A Mercator map can never fully show the polar areas, since linear scale becomes infinitely high at the poles. Being a conformal projection, angles are preserved around all locations, however scale varies from place to place, distorting the size of geographical objects. In particular, areas closer to the poles are more affected, transmitting an image of the geometry of the planet which is more distorted the closer to the poles. At latitudes higher than 70° north or south, the Mercator projection is practically unusable.

All lines of constant bearing ( rhumb lines or loxodromes — those making constant angles with the meridians), are represented by straight segments on a Mercator map. This is precisely the type of route usually employed by ships at sea, where compasses are used to indicate geographical directions and to steer the ships. The two properties, conformality and straight rhumb lines, make this projection uniquely suited to marine navigation: courses and bearings are measured using wind-roses or protractors, and the corresponding directions are easily transferred from point to point, on the map, with the help of a parallel ruler or a pair of navigational squares.
The name and explanations given by Mercator to his world map (Nova et Aucta Orbis Terrae Descriptio ad Usum Navigatium Emendate: "new and augmented description of Earth corrected for the use of navigation") show that it was expressly conceived for the use of marine navigation. Although the method of construction is not explained by the author, Mercator probably used a graphical method, transferring some rhumb lines previously plotted on a globe to a square graticule, and then adjusting the spacing between parallels so that those lines became straight, making the same angle with the meridians as in the globe.
The development of the Mercator projection represented a major breakthrough in the nautical cartography of the 16th century. However, it was much ahead of its time, since the old navigational and surveying techniques were not compatible with its use in navigation. Two main problems prevented its immediate application: the impossibility of determining the longitude at sea with adequate accuracy and the fact that magnetic directions, instead of geographical directions, were used in navigation. Only in the middle of the 18th century, after the marine chronometer was invented and the spatial distribution of magnetic declination was known, could the Mercator projection be fully adopted by navigators.
Several authors are associated with the development of Mercator projection:
- German Erhard Etzlaub (c. 1460–1532), who had engraved miniature "compass maps" (about 10x8 cm) of Europe and parts of Africa, latitudes 67°–0°, to allow adjustment of his portable pocket-size sundials, was for decades declared to have designed "a projection identical to Mercator’s". This has since proven to be an error, tracing back to doubtable research in 1917.
- Portuguese mathematician and cosmographer Pedro Nunes (1502–1578), who first described the loxodrome and its use in marine navigation, and suggested the construction of several large-scale nautical charts in the cylindrical equidistant projection to represent the world with minimum angle distortion (1537).
- English mathematician Edward Wright (c. 1558–1615), who formalized the mathematics of Mercator projection (1599), and published accurate tables for its construction (1599, 1610).
- English mathematicians Thomas Harriot (1560–1621) and Henry Bond (c.1600–1678) who, independently (c. 1600 and 1645), associated the Mercator projection with its modern logarithmic formula, later deduced by calculus.
Mathematics of the projection

The following equations determine the x and y coordinates of a point on a Mercator map from its latitude φ and longitude λ (with λ0 being the longitude in the centre of map):
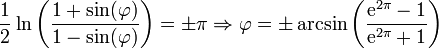
This is the inverse of the Gudermannian function:
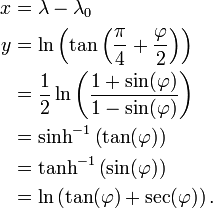
This is the Gudermannian function:
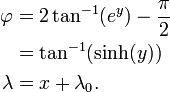
The scale is proportional to the secant of the latitude φ, getting arbitrarily large near the poles, where φ = ±90°. Moreover, as seen from the formulas, the pole's y is plus or minus infinity.
Derivation of the projection

Assume a spherical Earth. (It is actually slightly flattened, but for small-scale maps the difference is immaterial. For more precision, interpose conformal latitude.) We seek a transform of longitude-latitude (λ, φ) to Cartesian (x, y) that is "a cylinder tangent to the equator" (i.e. x = λ) and conformal, so that:
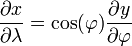
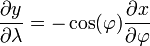
From x = λ we get


giving
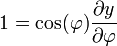

Thus y is a function only of φ with  from which a table of integrals gives

It is convenient to map φ = 0 to y = 0, so take C = 0.
Uses


Like all map projections that attempt to fit a curved surface onto a flat sheet, the shape of the map is a distortion of the true layout of the Earth's surface. The Mercator projection exaggerates the size of areas far from the equator. For example:
- Greenland is presented as having roughly as much land area as Africa, when in fact Africa's area is approximately 14 times that of Greenland.
- Alaska is presented as having similar or even slightly more land area than Brazil, when Brazil's area is actually more than 5 times that of Alaska.
- Finland is presented as having a greater North-South extent as India, when this distance is much larger in India than Finland.
Although the Mercator projection is still in common use for navigation, due to its unique properties, cartographers agree that it is not suited to representing the entire world in publications or wall maps due to its distortion of land area. Mercator himself used the equal-area sinusoidal projection to show relative areas. As a result of these criticisms, modern atlases no longer use the Mercator projection for world maps or for areas distant from the equator, preferring other cylindrical projections, or forms of equal-area projection. The Mercator projection is still commonly used for areas near the equator, however, where distortion is minimal.
Arno Peters stirred controversy when he proposed what is known as the Gall-Peters projection, a slight modification of the Lambert Cylindrical Equal-Area projection, as the alternative to the Mercator. A 1989 resolution by seven North American geographical groups decried the use of all rectangular-coordinate world maps, including the Mercator and Gall-Peters.
Google Maps currently uses a Mercator projection for its map images. Despite its relative scale distortions, the Mercator is well-suited as an interactive world map that can be panned and zoomed seamlessly to local maps. (Google Satellite Maps, on the other hand, used a plate carrée projection until 2005-07-22.)
The Google Maps maximum latitude φ occurs at ±85.05113 degrees when the Mercator y value = π. Or more precisely: