Khan Academy on a Stick
Graphing and analyzing linear functions
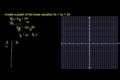
Use the power of algebra to understand and interpret points and lines (something we typically do in geometry). This will include slope and the equation of a line.
-
 Descartes and Cartesian coordinates
Bridging algebra and geometry. What makes linear equations so linear.
-
 The coordinate plane
Let's get familiar with the x/y coordinate plane, both from the perspective of plotting points and interpreting the placement of points on a plane.
-
 Coordinate plane: plot ordered pairs
We're plotting an ordered pair on the x (horizontal) axis and y (vertical) axis of the coordinate plane.
-
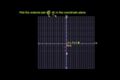
 Coordinate plane: graphing points
This exercise asks us to graph a set of points from an ordered pair on the x and y axis of a coordinate plane.
-
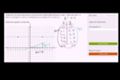
 Coordinate plane: quadrants
You like dividing up a pizza into slices? In geometry, we slice up the coordinate plane into quadrants. Although these are more like squares than triangular pizza slices! Let's learn about them.
-
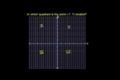
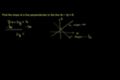
 Coordinate plane: graphing points and naming quadrants
This is a great exercise example in which we plot the ordered pair and then identify which quadrant the point lies. You'll get the hang of this quickly!
-
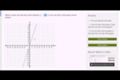
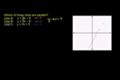
 Coordinate plane: have all the points been graphed?
Some of the given ordered pairs are already graphed on the coordinate pane in this example, but not all of them. Can you tell which haven't?
-
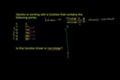
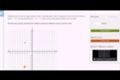 Coordinate plane: word problem exercise
In this word problem, we need to plot the ordered pairs and then figure out the difference in the y coodinate between the two. This will give us our answer!
-
 Coordinate plane: reflecting points
Just like looking at a mirror image of yourself, but flipped....a reflection point is the mirror point on the opposite axis. Watch this tutorial and reflect :)
Coordinate plane
How can we communicate exactly where something is in two dimensions? Who was this Descartes character? In this tutorial, we cover the basics of the coordinate plane. We then delve into graphing points and determining whether a point is a solution of an equation. This will be a great tutorial experience if you are just starting to ramp up your understanding of graphing or need some fundamental review.
-
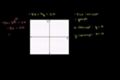
 Ordered pair solutions of equations
Ordered pair solutions of equations
-
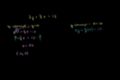
 Ordered pair solutions of equations 2
Ordered Pair Solutions of Equations
-
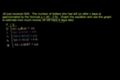
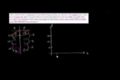
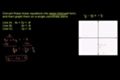
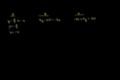
 Determining a linear equation by trying out values from a table
-
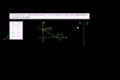
 Plotting (x,y) relationships
Plotting (x,y) relationships
-
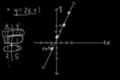
 Graphs of linear equations
-
 Application problem with graph
Application problem with graph
-
 Interpreting linear graphs
Interpreting Linear Graphs
-
 Exploring linear relationships
Exploring linear relationships
-
 Recognizing linear functions
Recognizing Linear Functions
-
 Graphing lines 1
Graphing linear equations
Graphing solutions to equations
In this tutorial, we'll work through examples that show how a line can be viewed as all of coordinates whose x and y values satisfy a linear equation. Likewise, a linear equation can be viewed as describing a relationship between the x and y values on a line.
-
 Graphing using x- and y-intercepts
Graphing using X and Y intercepts
-
 Graphing using intercepts
-
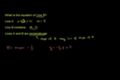
 x- and y-intercepts
X and Y intercepts
-
 x- and y-intercepts 2
X and Y intercepts 2
-
 Finding x intercept of a line
-
 Finding intercepts for a linear function from a table
-
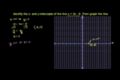
 Interpreting intercepts of linear functions
x-intercepts and y-intercepts of linear functions
There are many ways to graph a line and this tutorial covers one of the simpler ones. Since you only need two points for a line, let's find what value an equation takes on when x = 0 (essentially the y-intercept) and what value it takes on when y = 0 (the x-intercept). Then we can graph the line by going through those two points.
-
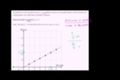
 Analyzing and identifying proportional relationships
Keep in mind that you have a proportional relationship if the ratio between the variables is always the same. In this example we'll graph this relationship along an x and y axis to find our answer.
-
 Analyzing proportional relationships in a graph
Let's use our knowledge of proportional relationships to interpret a graph that maps out the number of hours spent on computer games vs hours spent on homework. We know which one you spend more time on!
-
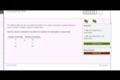 Analyzing proportional relationships from a table
Given a table of ratios, watch as we test them for equivalence and determine whether the relationship is proportional.
-
 Comparing proportional relationships
Here's a challenge: construct equations to determine if the relationships are proportional. Use your knowledge of algebra and graphs to compare ratios.
-
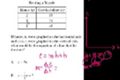
 Constructing an equation for a proportional relationship
Write an equation that describes the proportional relationship between a table of two variables. We're building on our knowledge of algebra and ratios and proportions.
-
 Graphing proportional relationships example
-
 Graphing proportional relationships example 2
-
 Graphing proportional relationships example 3
Proportional relationships
In this tutorial we'll think deeper about how one variable changes with respect to another. Pay attention because you'll find that these ideas will keep popping up in your life!
-
 Comparing rates
-
 Representing and comparing rates
-
 Rate problem using fractions
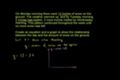
One common application of rate is determining speed. Watch as we solve a rate problem finding speed in meters per second using distance (in meters) and time (in seconds).
-
 Unit cost problem using fractions
In this example, we show how unit cost can be determined using an equation with fractions.
Rates for proportional relationships
In proportional relationships, the ratio between one variable and the other is always constant. In the context of rate problems, this constant ratio can also be considered a rate of change. This tutorial allows you dig deeper into this idea.
-
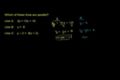
 Slope of a line
Slope of a line
-
 Slope of a line 2
Slope of a Line 2
-
 Slope and rate of change
-
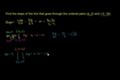
 Graphical slope of a line
Graphical Slope of a Line
-
 Slope of a line 3
Slope of a Line 3
-
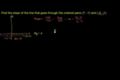
 Slope example
Slope Example
-
 Slope and y-intercept intuition
Using the "Graph of a line" module to understand how a line's graph changes when its slope or y-intercept is changed.
-
 Intuitive understanding of slope example
Slope
If you've ever struggled to tell someone just how steep something is, you'll find the answer here. In this tutorial, we cover the idea of the slope of a line. We also think about how slope relates to the equation of a line and how you can determine the slope or y-intercept given some clues. This tutorial is appropriate for someone who understands the basics of graphing equations and want to dig a bit deeper. After this tutorial, you will be prepared to start thinking deeper about the equation of a line.
-
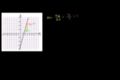
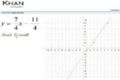
 Graphing a line in slope intercept form
Graphing a line in slope intercept form
-
 Converting to slope-intercept form
Converting to slope-intercept form
-
 Fitting a line to data
Graphing linear equations in slope-intercept form
Math is beautiful because there are so many way to appreciate the same relationship. In this tutorial, we'll use our knowledge of slope to actually graph lines that have been expressed in slope-intercept form.
-
 Multiple examples of constructing linear equations in slope-intercept form
Linear Equations in Slope Intercept Form
-
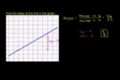
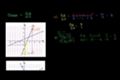
 Constructing equations in slope-intercept form from graphs
-
 Constructing linear equations to solve word problems
Constructing linear equations to solve word problems
-
 Linear equation from slope and a point
Equation of a line
-
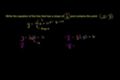
 Finding a linear equation given a point and slope
Equation of a line 2
-
 Equation of a line from fractional slope and point
u13 l2 t2 we INT Equation of a Line hairier example
-
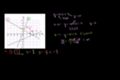
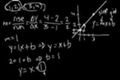
 Constructing the equation of a line given two points
Equation of a line 3
-
 Finding y intercept given slope and point
-
 Slope intercept form from table
Constructing equations in slope-intercept form
You know a bit about slope and intercepts. Now we will develop that know-how even further to construct the equation of a line in slope-intercept form.
-
 Idea behind point slope form
-
 Linear equations in point slope form
Linear Equations in Point Slope Form
-
 Linear equations in standard form
Linear Equations in Standard Form
-
 Point-slope and standard form
Point-slope and standard form
-
 Converting from point slope to slope intercept form
Point-slope form and standard form
You know the slope of a line and you know that it contains a certain point. Well, in this tutorial, you'll see that you can quickly take this information (and that knowledge the definition of what slope is) to construct the equation of this line in point-slope form! You'll also manipulate between point-slope, slope-intercept and standard form.
-
 Midpoint formula
Midpoint Formula
-
 The Pythagorean theorem intro
Introduction to the Pythagorean Theorem
-
 Distance formula
How to find the distance between lines using the Pythagorean Formula
-
 Perpendicular line slope
u13 l2 t3 we1 Perpendicular Line Slope
-
 Equations of parallel and perpendicular lines
Equations of Parallel and Perpendicular Lines
-
 Parallel line equation
Parallel Line Equation
-
 Parallel lines
Parallel Lines
-
 Parallel lines 2
Parallel Lines 2
-
 Parallel lines 3
Parallel lines 3
-
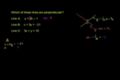 Perpendicular lines
Perpendicular Lines
-
 Perpendicular lines 2
Perpendicular lines 2
-
 Distance between a point and a line
-
 Algebra: Slope and y-intercept intuition
Getting a feel for slope and y-intercept
-
 Algebra: Equation of a line
Determining the equation of a line
-
 CA Algebra I: Slope and y-intercept
27-32, figuring out the slope, y-intercept and equation of a line
More analytic geometry
You're familiar with graphing lines, slope and y-intercepts. Now we are going to go further into analytic geometry by thinking about distances between points, midpoints, parallel lines and perpendicular ones. Enjoy!
-
 Graphing inequalities
Graphing Inequalities
-
 Solving and graphing linear inequalities in two variables 1
Solving and graphing linear inequalities in two variables
-
 Graphing linear inequalities in two variables example 2
Graphing Linear Inequalities in Two Variables
-
 Graphing inequalities 2
Graphing Inequalities 2
-
 Graphing linear inequalities in two variables 3
Graphing linear inequalities in two variables
-
 Graphing inequalities 1
Graphing Inequalities
-
 CA Algebra I: Graphing inequalities
21-26, graphing inequalities and testing assertions
Graphing linear inequalities
In this tutorial we'll see how to graph linear inequalities on the coordinate plane. We'll also learn how to determine if a particular point is a solution of an inequality.
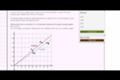
 Similar triangles to prove that the slope is constant for a line
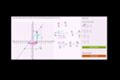 Slope and triangle similarity 1
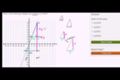 Slope and triangle similarity 2
 Slope and triangle similarity 3
 Slope and triangle similarity 4
Triangle similarity and constant slope
Use similar triangles to explain why the slope m is the same between any two distinct points on a non-vertical line in the coordinate plane. We'll connect this idea to the equation y = mx for a line through the origin and the equation y = mx + b for a line intercepting the vertical axis at b (cc.8.ee.6).
 Average rate of change (example 1)
 Average rate of change (example 2)
 Average rate of change (example 3)
 Average rate of change when function defined by equation
Average rate of change
Even when a function is nonlinear, we can calculate the average rate of change over an interval (we'll need calculus to calculate the rate of change at a particular value of the independent variable). This tutorial will give you practice doing just that.
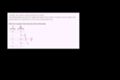
 Reasonable scale for plotting data
 Thinking about slope and units
 Graphing relationship between rate and duration