 |
This is a file from the Wikimedia Commons. Information from its description page there is shown below.
Commons is a freely licensed media file repository. You can help.
|
 |
This graph image could be recreated using vector graphics as an SVG file. This has several advantages; see Commons:Media for cleanup for more information. If an SVG form of this image is already available, please upload it. After uploading an SVG, replace this template with {{ vector version available|new image name.svg}}. |
Summary
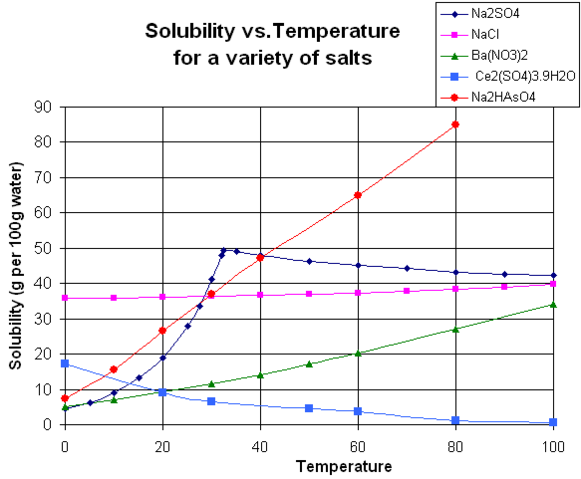
Graph of solubility data for various inorganic salts, drawn in Microsoft Excel and coloured pencil, and scanned in by User:Walkerma, January 2006. Data taken from the Handbook of Chemistry and Physics, 27th edition, Chemical Rubber Publishing Co., Cleveland, Ohio, 1943. The last two figures for cerium(III) sulfate represent the pentahydrate rather than the enneahydrate.
derivative works
Derivative works of this file:
Licensing
| Public domainPublic domainfalsefalse |
 |
I, the copyright holder of this work, release this work into the public domain. This applies worldwide.
In some countries this may not be legally possible; if so:
I grant anyone the right to use this work for any purpose, without any conditions, unless such conditions are required by law.Public domainPublic domainfalsefalse
|
File usage
The following pages on Schools Wikipedia link to this image (list may be incomplete):
This file contains additional information, probably added from the digital camera or scanner used to create or digitize it. If the file has been modified from its original state, some details may not fully reflect the modified file.
Schools Wikipedia was created by children's charity SOS Children. SOS Childrens Villages works in 133 countries and territories across the globe, helps more than 62,000 children, and reaches over 2 million people in total. We have helped children in Africa for many years - you can help too...


