
File:Sachin Tendulkar graph.png
| |
This is a file from the Wikimedia Commons. Information from its description page there is shown below.
Commons is a freely licensed media file repository. You can help. |
 |
File:Sachin Tendulkar graph.svg is a vector version of this file. It should be used in place of this raster image when superior. File:Sachin Tendulkar graph.png
For more information about vector graphics, read about Commons transition to SVG.
|
|
Summary
| Description |
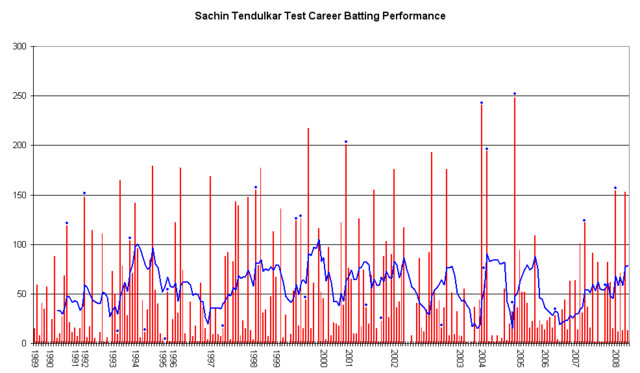
English: This graph details the Test Match performance of Sachin Tendulkar. It was created by Raven4x4x. The red bars indicate the player's test match innings, while the blue line shows the average of the ten most recent innings at that point. Note that this average cannot be calculated for the first nine innings. The blue dots indicate innings in which Tendulkar finished not-out.
This graph was generated with Microsoft Excel 2002, using data from Cricinfo and Howstat . The information in this chart is current as of 2 February, 2008. |
| Date | 2 February 2008 (original upload date) |
| Source | Own work Transferred from en.wikipedia |
| Author | Raven4x4x at en.wikipedia |
Licensing
 |
This work has been released into the public domain by its author, Raven4x4x at the wikipedia project. This applies worldwide. In case this is not legally possible: |
File usage
Schools Wikipedia facts
Wikipedia for Schools is one of SOS Childrens Villages' many educational projects. More than 2 million people benefit from the global charity work of SOS Childrens Villages, and our work in 133 countries around the world is vital to ensuring a better future for vulnerable children. Have you thought about sponsoring a child?