|
This is a file from the Wikimedia Commons. Information from its description page there is shown below.
Commons is a freely licensed media file repository. You can help.
|
| Description |
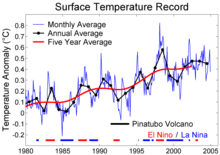
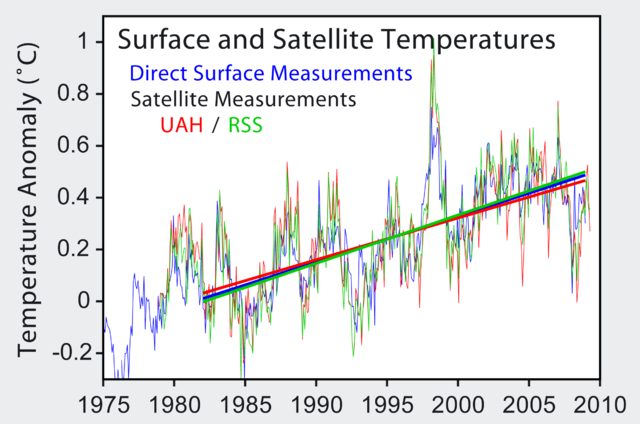
The last 25 years of surface measurements with various averages and a comparison to El Niño and volcanic forcing.
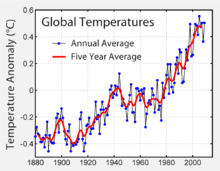
The surface temperature record extended back to 1880.
(UAH 2003; data set tltglhmam version 5.2 with 2009 updates) and Schabel et al. (RSS 2002; data set tlt_land_and_ocean with 2009 updates). These two satellite records reflect two different ways of interpreting the same set of microwave sounder measurements and are not independent records. Each record is plotted as the monthly average and straight lines are fit through each data set from January 1982 to December 2009. The slope of these lines are 0.187° C/decade, 0.163°C/decade, and 0.239°C/decade for the surface, UAH, and RSS respectively. The 5.2 version of Christy et al.'s satellite temperature record contains a significant correction over previous versions. In summer 2005, Mears and Wentz (2005) discovered that the UAH processing algorithms were incorrectly adjusting for diurnal variations, especially at low latitude. This correction raised the trend line 0.035°C/decade, and in so doing brought it into much better agreement with the ground based records and with independent satellite based analysis (e.g. Fu et al. 2004). The discovery of this error also explains why their satellite based temperature trends had disagreed most prominently in the tropics. Within measurement error, all of these records paint a similar picture of temperature change and global warming. However, climate models predict carbon dioxide based greenhouse warming should result in lower atmosphere warming roughly 1.3 times higher than the surface warming. This prediction is consistent with the RSS vs. surface comparison, though by contrast the UAH vs. surface comparison suggests a troposphere warming by slightly less than the surface of the Earth. Note: In the above figure, there is still a significant discrepancy between the very earliest satellite measurements and the ground based measurements at that time. For this reason only the interval 1982-2005 was used in calculating each trend. Including the earliest years leads to a wider dispersion , with trends of 0.170°C/decade, 0.116°C/decade, and 0.192°C/decade for the surface, UAH, and RSS data respectively. The origin of this discrepancy is unclear. This figure was prepared by Robert A. Rohde from publicly available data and is incorporated into the Global Warming Art project.
- Jones, P.D. and Moberg, A. (2003). "Hemispheric and large-scale surface air temperature variations: An extensive revision and an update to 2001". Journal of Climate 16: 206-223.
- Christy, J.R., R.W. Spencer, W.B. Norris, W.D. Braswell and D.E. Parker (2003). "Error estimates of version 5.0 of MSU/AMSU bulk atmospheric temperatures". J. Atmos. Oceanic Technol. 20: 613-629.
- Fu, Q., Johanson, C. M., Warren, S. G. & Seidel, D. J. (2004). "Contribution of stratospheric cooling to satellite-inferred tropospheric temperature trends". Nature 429: 55−58.
- Mears, Carl A. and Frank J. Wentz (2005). "The Effect of Diurnal Correction on Satellite-Derived Lower Tropospheric Temperature". Science Express : published online 11 August 2005.
- Matthias C. Schabel, Carl A. Mears, Frank J. Wentz (2002). "Stable Long-Term Retrieval of Tropospheric Temperature Time Series from the Microwave Sounding Unit". Proceedings of the International Geophysics and Remote Sensing Symposium III: 1845-1847.
|
| Date |
|
| Source |
http://www.cru.uea.ac.uk/cru/data/temperature/ |
| Author |
This file is lacking author information.
|
Summary ==
- Further information: Satellite temperature measurements
Image from Global Warming Art
This image is an original work created for Global Warming Art. Please refer to the image description page for more information.
 |
Permission is granted to copy, distribute and/or modify this document under the terms of the GNU Free Documentation License, Version 1.2 or any later version published by the Free Software Foundation; with no Invariant Sections, no Front-Cover Texts, and no Back-Cover Texts. A copy of the license is included in the section entitled GNU Free Documentation License. http://www.gnu.org/copyleft/fdl.htmlGFDLGNU Free Documentation Licensetruetrue
|
File usage
The following pages on Schools Wikipedia link to this image (list may be incomplete):
SOS Childrens Villages chose the best bits of Wikipedia to help you learn. By supporting vulnerable children right through to adulthood, SOS Children's Villages makes a lasting difference to the lives of thousands of people. Education is a key part of our work, and our schools provide high-quality teaching to the children in our care. There are many ways to help with SOS Children.