 |
This is a file from the Wikimedia Commons. Information from its description page there is shown below.
Commons is a freely licensed media file repository. You can help.
|
Summary
| DescriptionSw real gdp growth.svg |
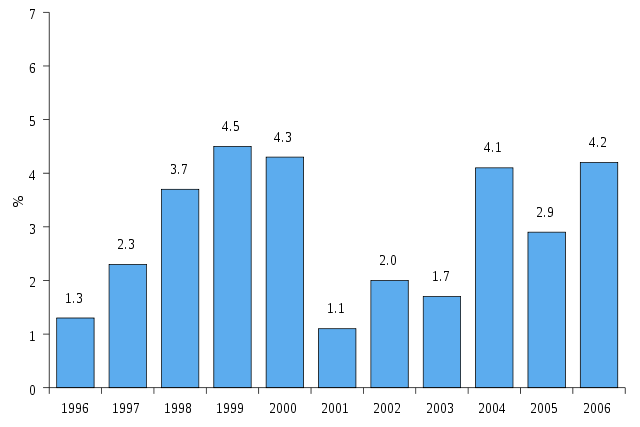
English: Annual change in the real GDP of Sweden from 1996 to 2006
|
| Date |
18 June 2007 |
| Source |
Eurostat database (GDP - Constant prices, percentage change on previous period), graph own work |
| Author |
Jkv |
Permission
( Reusing this file) |
PD-Own
|
R source
#R version 2.3, www.r-project.org
#Eurostat GDP constant prices, percentage change on previous period
#Sweden 1996 - 2006
x <- c(1.3,2.3,3.7,4.5,4.3,1.1,2.0,1.7,4.1,2.9,4.2)
names(x) <- 1996:2006
library("RSvgDevice")
devSVG("sw_real_gdp_growth.svg", width = 12, height = 8)
par(mar=c(3.2,4,1,0),las=1,mgp=c(2.2,1,0),cex=2)
y <- barplot(x,ylim=c(0,7),ylab="%",
             space=.4,col="steelblue2",xlim=c(.2,16),xaxs="i")
text(y,x+.3,format(x,digits=2))
axis(1,c(.2,y+.7),labels=F)
dev.off()
Licensing
| Public domainPublic domainfalsefalse |
 |
This work has been released into the public domain by its author, I, Jkv. This applies worldwide.
In some countries this may not be legally possible; if so:
I, Jkv grants anyone the right to use this work for any purpose, without any conditions, unless such conditions are required by law.Public domainPublic domainfalsefalse
|
File usage
The following pages on Schools Wikipedia link to this image (list may be incomplete):
This file contains additional information, probably added from the digital camera or scanner used to create or digitize it. If the file has been modified from its original state, some details may not fully reflect the modified file.
SOS Childrens Villages has brought Wikipedia to the classroom. By supporting vulnerable children right through to adulthood, SOS Children makes a lasting difference to the lives of thousands of people. Education is a key part of our work, and our schools provide high-quality teaching to the children in our care. Will you help another child today?


