
File:Winter-NAO-Index.png
- File
- File usage
- What is Schools Wikipedia?
Size of this preview: 640 × 399 pixels.
| |
This is a file from the Wikimedia Commons. Information from its description page there is shown below.
Commons is a freely licensed media file repository. You can help. |
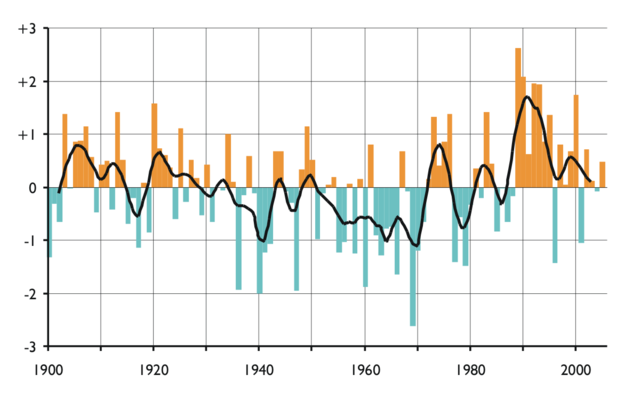
- Description: North Atlantic Oscillation (NAO) index. Year is on the x-axis (1900–2005), and the standardised principal-component based winter NAO index on the y-axis. The bars show each winter's mean NAO index (where for instance "winter 1900" means the period from December 1899 up to and including March 1900). The black line is the 5-year running mean of the same index values (smoothed with a Gaussian filter).
- Source: graph drawn by Hanno using data published on the web by J.W. Hurrell (Climate Analysis Section, National Centre for Atmospheric Research, Boulder, Colorado, USA) as "Climate indices" [ http://www.cgd.ucar.edu/cas/jhurrell/indices.html]
- Licence: released into the public domain by the originator
 |
I, the copyright holder of this work, release this work into the public domain. This applies worldwide. In some countries this may not be legally possible; if so: I grant anyone the right to use this work for any purpose, without any conditions, unless such conditions are required by law.
|
 |
File:Winter-NAO-Index.svg is a vector version of this file. It should be used in place of this raster image when superior. File:Winter-NAO-Index.png
For more information about vector graphics, read about Commons transition to SVG.
|
 |
What is Schools Wikipedia?
SOS Children's Villages has brought Wikipedia to the classroom. By supporting vulnerable children right through to adulthood, SOS Children makes a lasting difference to the lives of thousands of people. Education is a key part of our work, and our schools provide high-quality teaching to the children in our care. Why not try to find out more about sponsoring a child?