
File:Solar evolution (English).svg
| |
This is a file from the Wikimedia Commons. Information from its description page there is shown below.
Commons is a freely licensed media file repository. You can help. |
Summary
| Description |
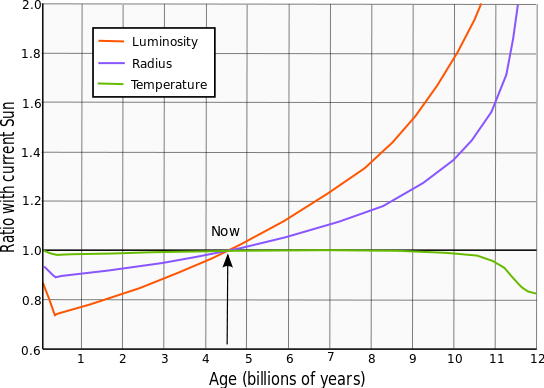
English: This graph shows the evolution of the Sun's luminosity, radius and effective temperature compared to the present Sun. The left edge represents the zero-age main sequence, while the right is the start of the red giant phase.
|
| Date | 30 September 2011 |
| Source | Own work, based on figure 1, Ribas, Ignasi (2010), "The Sun and stars as the primary energy input in planetary atmospheres", Solar and Stellar Variability: Impact on Earth and Planets, Proceedings of the International Astronomical Union, IAU Symposium, 264, pp. 3–18, en:Bibcode 2010IAUS..264....3R |
| Author | RJHall |
Licensing
|
File usage
The following pages on Schools Wikipedia link to this image (list may be incomplete):
Metadata
Schools Wikipedia and SOS Children
Wikipedia for Schools is one of SOS Childrens Villages' many educational projects. SOS Children works in 133 countries and territories across the globe, helps more than 62,000 children, and reaches over 2 million people in total. Have you thought about sponsoring a child?