
File:Glacier Mass Balance.png

| |
This is a file from the Wikimedia Commons. Information from its description page there is shown below.
Commons is a freely licensed media file repository. You can help. |
 |
This graph image could be recreated using vector graphics as an SVG file. This has several advantages; see Commons:Media for cleanup for more information. If an SVG form of this image is already available, please upload it. After uploading an SVG, replace this template with {{ vector version available|new image name.svg}}. |
Contents |
Summary
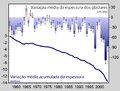
This figure shows the average rate of thickness change in mountain glaciers around the world. This information, known as the glaciological mass balance, is found by measuring the annual snow accumulation and subtracting surface ablation driven by melting, sublimation, or wind erosion. These measurements do not account for thinning associated with iceberg calving, flow related thinning, or subglacial erosion. All values are corrected for variations in snow and firn density and expressed in meters of water equivalent (Dyurgerov 2002).
Measurements are shown as both the annual average thickness change and the accumulated change during the fifty years of measurements presented. Years with a net increase in glacier thickness are plotted upwards and in red; years with a net decrease in glacier thickness (i.e. positive thinning) are plotted downward and in blue. Only three years in the last 50 have experienced thickening in the average.
Systematic measurements of glacier thinning began in the 1940s, but fewer than 15 sites had been measured each year until the late 1950s. Since then more than 100 sites have contributed to the average in some years (Dyurgerov 2002, Dyurgerov and Meier 2005). Error bars indicate the standard error in the mean.
Other observations, based on glacier length records, suggest that glacier retreat has occurred nearly continuously since the early 1800s and the end of the little ice age, but variations in rate have occurred, including a significant acceleration during the twentieth century that is believed to have been a response to global warming (Oerlemans 2005).
Data
These measurements are described in Dyurgerov (2002), updated in Dyurgerov and Meier (2005), and archived at the World Glacier Monitoring Service at the National Snow and Ice Data Centre.
Copyright
This figure was prepared by Robert A. Rohde from published data and is part of the Global Warming Art project.
 |
Permission is granted to copy, distribute and/or modify this document under the terms of the GNU Free Documentation License, Version 1.2 or any later version published by the Free Software Foundation; with no Invariant Sections, no Front-Cover Texts, and no Back-Cover Texts. A copy of the license is included in the section entitled GNU Free Documentation License.
|
| This file is licensed under the Creative Commons Attribution-Share Alike 3.0 Unported license. | ||
|
||
| This licensing tag was added to this file as part of the GFDL licensing update.
|
References
- Dyurgerov, Mark B. (2002). "Glacier Mass Balance and Regime: Data of Measurements and Analysis". Institute of Arctic and Alpine Research, Occasional Paper 55.
- Dyurgerov, Mark B. and Mark F. Meier (2005). "Glaciers and the Changing Earth System: A 2004 Snapshot". Institute of Arctic and Alpine Research, Occasional Paper 58.
- J. Oerlemans (2005). "Extracting a Climate Signal from 169 Glacier Records". Science 308 (5722): 675-677. DOI: 10.1126/science.1107046.
Other versions
-
Portuguese
File usage
About Schools Wikipedia
SOS Children chose the best bits of Wikipedia to help you learn. SOS Children helps those who have nothing and no one, giving them back the famly they have lost and bringing them the very best opportunities for a happy, healthy future. If you'd like to help, why not learn how to sponsor a child?